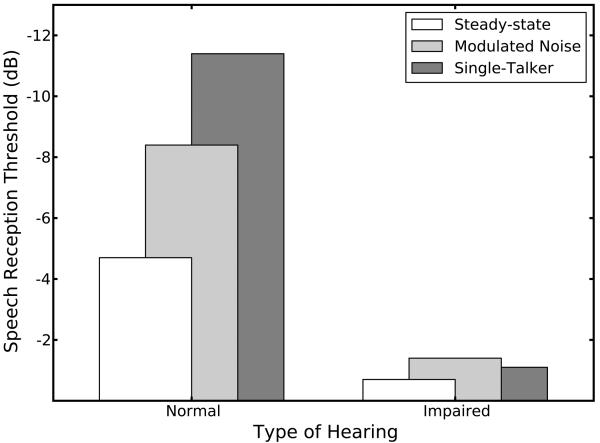
Fig. 1.
Data estimated from Fig. 6 in Festen and Plomp (1990). Bars in the left column represent SRT performance by normal-hearing listeners, bars in the right column by listeners with HI. White bars indicate SRTs in steady-state noise, light gray bars indicate SRTs in modulate noise and dark gray indicate SRTs in a single-talker background. For each group of listeners, the difference between the white and gray bars represents the release from masking due to modulation.

