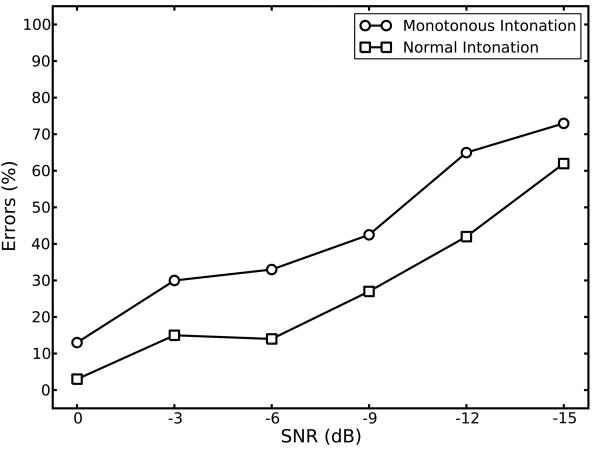
Fig. 2.
Data estimated from Figs. 3 and 5 in Brokx and Nooteboom (1982). Percent errors as a function of SNR when intonation was either monotonous (circles) or normal (squares). The percent errors decreased by an average of about 15 percentage points across SNRs with the addition of normal intonation.

