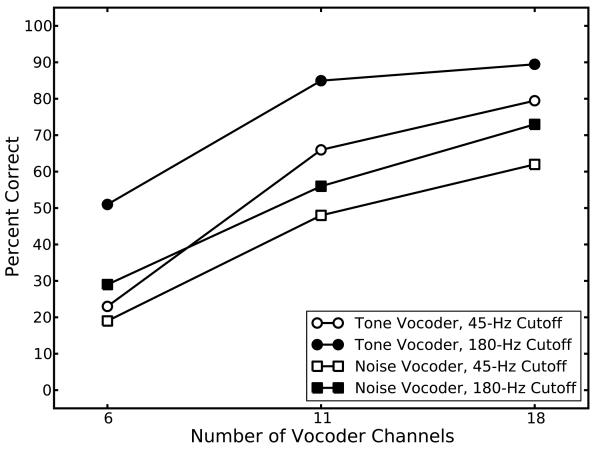
Fig. 3.
Data estimated from Fig. 3 in Stone et al. (2008). Mean percent correct intelligibility as a function of number of vocoder channels. Plots with square symbols represent performance when the vocoder used noise band carriers; plots with circles represent sinusoidal carriers. Open symbols represent performance when the cutoff frequency of the envelope extraction filter was 45 Hz, whereas filled symbols represent performance when the cutoff was 180 Hz.

