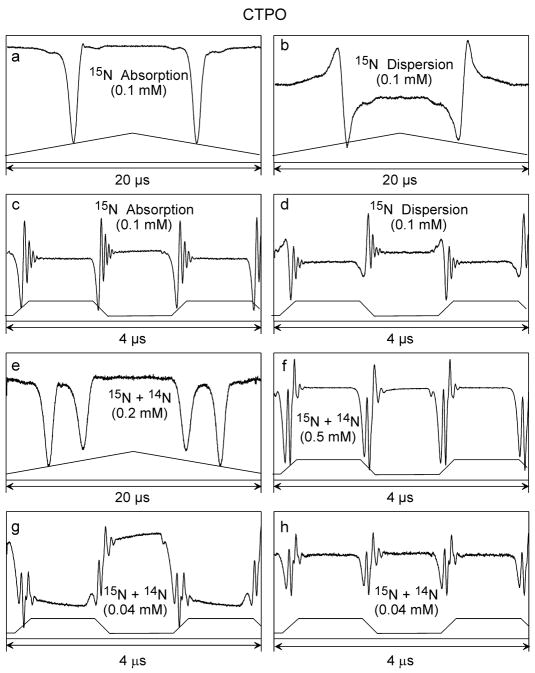
Figure 8.
Representative swept-frequency responses for the CTPO samples. Figures 8a and b used 50 kHz triangular waveforms of 44.7 MHz deviation centered on the low field line. Figure 8e used 50 kHz triangular waveforms of 45.3 MHz deviation centered between the two low field lines of 14N + 15N CTPO. Figures 8c, d, f, g, and h used the trapezoidal waveform of 36.7 MHz deviation centered on the low field or between the two low field lines of the 14N + 15N CTPO. Sweep rates are 0.147 MHz/ns (equivalent to 3.2 kT/s). Figures 8c and h are double-baseline corrected.

