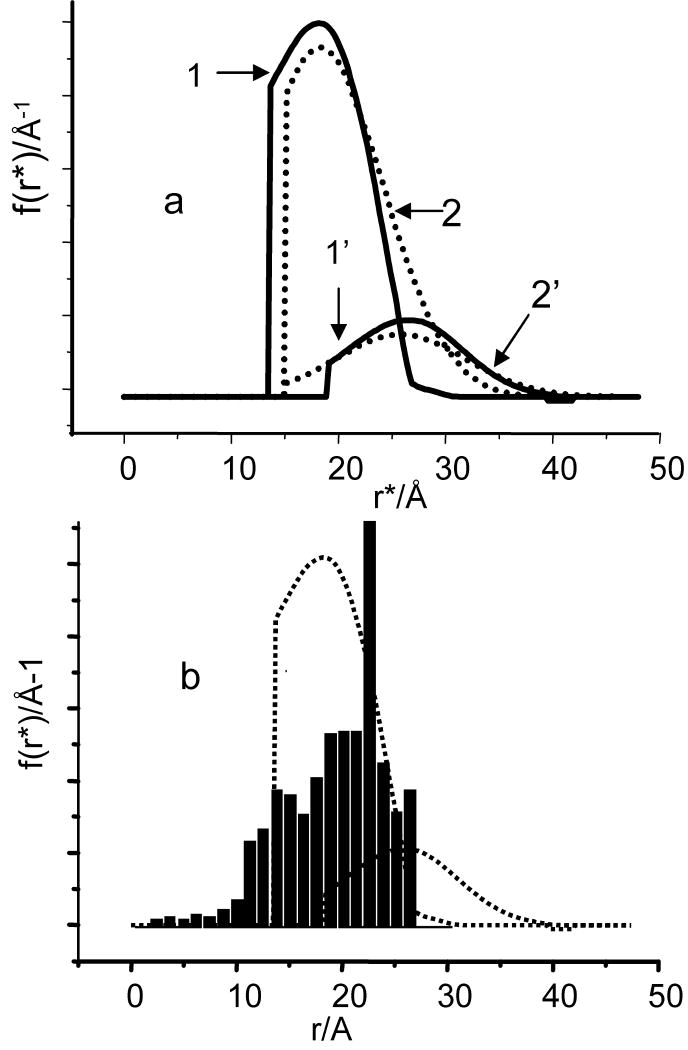
Fig.8.
(a) Solid lines, 1 and 1′: the parts of the distance distribution functions between the two Gd(III) ions in C2-Gd595, derived by processing intrapair TDPs presented in Fig.6a and c, curves 3. The TDPs were processed in accordance with Eq. 16. The functions are normalized to 0.4 and 0.11. First moment of these functions are 19.2Å and 25Å respectively. Dashed lines: The distribution functions (2 and 2′) obtained by processing the above mentioned TDPs by DeerAnalysys, Gaussian fit option. The functions are normalized accordingly. First moments of these functions were found 21A and 26.5A, respectively. The distribution functions derived by means of two other options, approximate Pake pattern and Tikhonov regularization and simulated TDP are presented in SI.
(b) (bars) The histogram of the distance distribution between Gd(III) ions in C2-Gd595. The details of the distribution modeling are presented in the text. Dashed lines are distribution functions shown in solid lines in (a).

