
Figure 1.
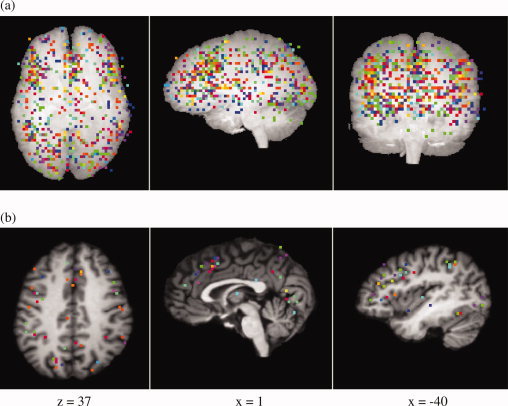
(a) 728 activation coordinates which were included in the analysis, projected onto three orthogonal single coronal, sagittal, and axial slices. (b) Three example slices showing activation coordinates projected onto an individual brain. Slices were chosen to show cortical areas which are frequently reported as significantly activated in the Stroop task (ACC, IFJ, preSMA). Activation coordinates from the same study are plotted in the same color. [Color figure can be viewed in the online issue, which is available at www.interscience.wiley.com.]