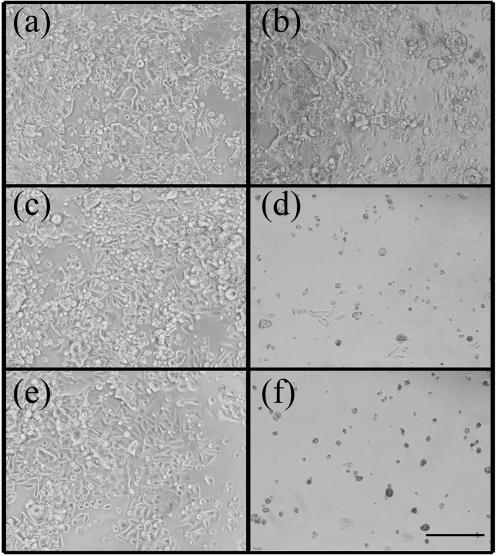
Fig. 4.
Micrographs of human SW480 colon cancer cells following 5 days of incubation with the different fatty acid treatments. (a, b) Linoleic acid control (extracted from broth); (a) 5 and (b) 20 μg (ml medium)−1. (c, d) E. coli (pEV01) fermented oils containing (c) 5 and (d) 20 μg (ml medium)−1 t10, c12 CLA. (e, f) L. lactis (pEV01) fermented oils containing (e) 5 and (f) 20 μg (ml medium)−1 t10, c12 CLA. All panels are ×100 magnification; bar, ** μm.

