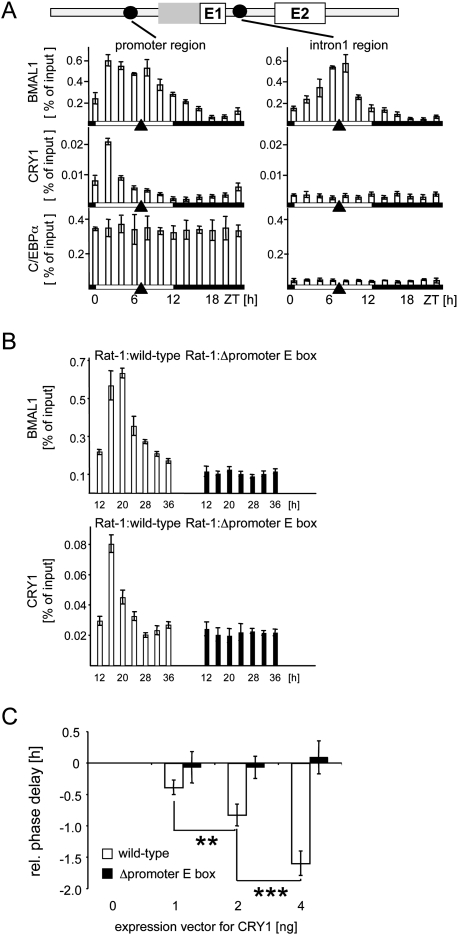
Figure 3.
Circadian binding of BMAL1 and CRY1 to the promoter region of Dbp. (A) Chromatin immunoprecipitation analysis using antibodies against BMAL1, CRY1, or C/EBPα, and chromatin from mouse liver tissue taken at 2-h intervals. The phases of light or dark are depicted below the graphs. Black triangles show the peak of transcriptional activity of the Dbp gene. The coimmunoprecipitated DNA fragments were quantified with real-time PCR probes specific for the promoter region or the intron 1 region. Shown is the amount of DNA coimmunoprecipitated from the input (% of input). (B) Chromatin immunoprecipitation analysis using antibodies against BMAL1 or CRY1, and chromatin from Rat-1 fibroblasts with a single-copy integration of a wild-type 6.9-kb fragment of the mDbp gene (white bars) or a mutated version without functional promoter E-box motif (black bars). The cells were synchronized with dexamethasone and chromatin prepared at the indicated time points. The coimmunoprecipitated DNA fragments were quantified using real-time PCR probes specific for the promoter region of the mouse transgene. (C) NIH 3T3 fibroblasts were cotransfected with either a wild-type mDbp-luciferase construct or the version with the inactivated promoter E-box motif, and increasing amounts (1, 2, or 4 ng) of an expression vector for mCRY1. Shown are the relative phases of reporter gene expression compared with the transfection without expression vector for CRY1 (n = 4; mean ± SD). One-way ANOVA with Bonferroni's post-test.

