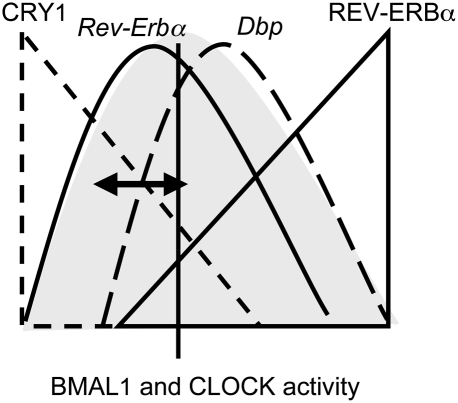
Figure 7.
Model of Dbp phase determination in the liver. During a certain time window of the day, BMAL1 and CLOCK may have an intrinsic transcriptional activation potential (gray shading) centered between the peaks of Dbp and Rev-Erbα expression. For Dbp, transcription is delayed in response to the nuclear CRY1 protein levels (dashed lines); for Rev-Erbα, the accumulation of REV-ERBα provokes autorepression (solid lines). Note that, in this simple model, the presence of CRY1 can shift the phase of Dbp expression closer to or further away from Rev-Erbα expression (black arrow).

