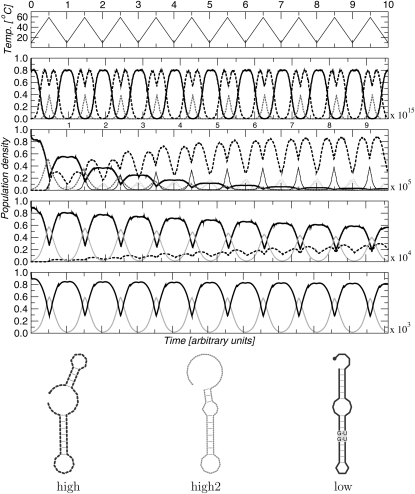
FIGURE 4.
Hysteresis effects in an thermosensitive RNA. In this example, the temperature cycles 10 times from 10 to 59°C, as shown at top. The second panel shows a nearly adiabatic temperature change (1015 time units per cycle), such that the system is always near equilibrium. Panels 3 to 5 show increasingly faster temperature cycles, with 105, 104, and 103 time units per cycle. The RNA has different optimal conformations at 10°C (solid black) and 59°C (dashed black), respectively. At high temperatures, furthermore, the minimum energy structure is nearly degenerate, so that an alternative structure (dotted gray) is populated in panels 2 and 3. For the very fast temperature cycle (bottom), the RNA is trapped in the low-temperature structure. Here, the only structural change is the opening of a GU:GU stack at high temperatures (gray area in structure drawing).

