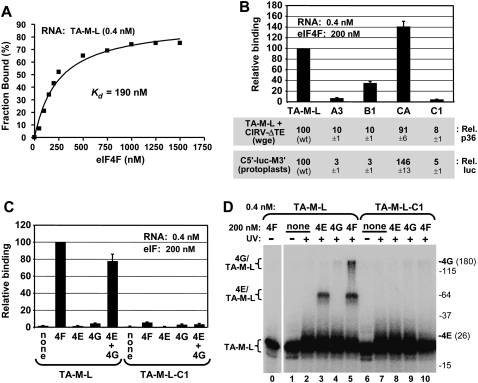
FIGURE 7.
Binding of the 3′CITE to eIF4F and its subunits. (A) Representative binding curve of the TA-M-L/eIF4F complex determined by filter-binding analysis and used to determine the Kd. 32P-labeled TA-M-L (0.4 nM) was incubated with the indicated amounts of eIF4F for 60 min at 25°C, and the fraction of bound RNA was determined by quantifying the radioactivity of protein–RNA complexes retained on a nitrocellulose membrane. (B) eIF4F binding and translation activities of TA-M-L and mutants. Relative binding levels of TA-M-L and its mutants to eIF4F were determined by filter-binding assays at the indicated concentrations (upper panel). Relative binding values were normalized to binding of WT TA-M-L to eIF4F (set to 100). TA-M-L and its mutants were assayed for translation activity via p36 levels in wge in coincubations with CIRV-ΔTE (middle panel), and corresponding 3′CITE mutants in C5′-luc-M3′ were assayed for translational activity via relative luciferase levels in protoplasts (lower panel). (C) Binding of TA-M-L and mutant TA-M-L-C1 to purified recombinant eIF4E, eIF4G, or both, was assayed by filter-binding at the concentrations indicated. Relative binding values were normalized to binding of WT TA-M-L to eIF4F (set to 100). (D) UV cross-linking analysis of TA-M-L and TA-M-L-C1 interactions with eIF4F and its subunits. Radiolabeled RNA (0.4 nM) was incubated with 200 nM eIF4F or its individual subunits for 60 min at 25°C and then irradiated with 254 nm light for 15 min, followed by separation by 10% SDS-PAGE. The positions of molecular weight markers in the gel are indicated to the right (in kDa) along with the locations of free eIF4E (26 kDa) and eIF4G (180 kDa) in the gel. The positions of bands corresponding to free RNA (TA-M-L) or RNA cross-linked with eIF4G (4G/TA-M-L) or eIF4E (4E/TA-M-L) are indicated to the left of the gel.

