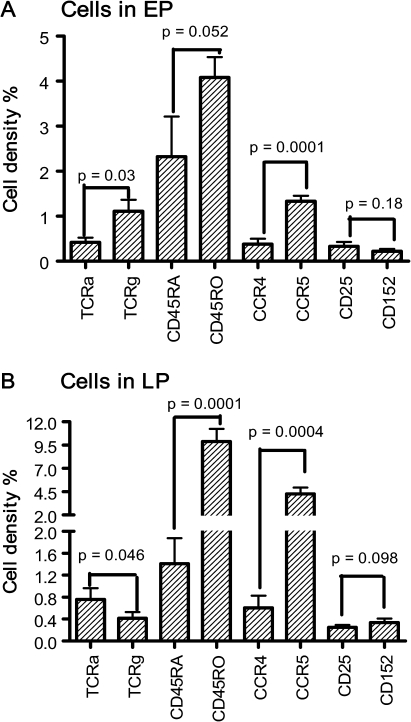
Figure 6.
Cellular populations in epithelium and lamina propria. The cell densities are presented as the percentages of specifically stained area against the total area of the histological section. Data are expressed as mean ± SE, n = 12, which is the number of subjects analyzed. EP, epithelium; LP, lamina propria; TCRa, α/β T cells; TCRg, γ/δ T cells.

