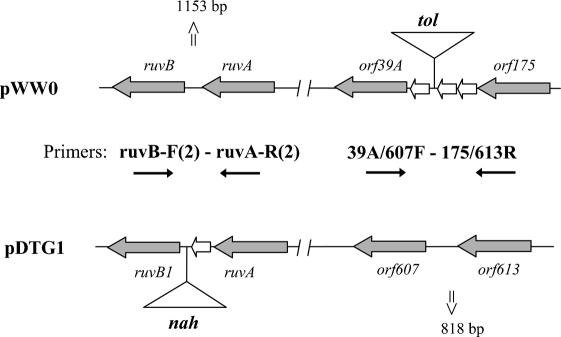
Fig. 4.
Schematic representation of the pWW0 versus pDTG1 plasmid alignment to show the location of the conserved primers specific to determinants flanking the insertions of corresponding catabolic pathways. The conserved primer pairs are shown by black arrows; the genetic determinants used for the primer design are shown by grey arrows; white triangles (tol and nah) indicate insertions of toluene and naphthalene catabolic pathways, respectively. The sizes of the expected PCR products are indicated.

