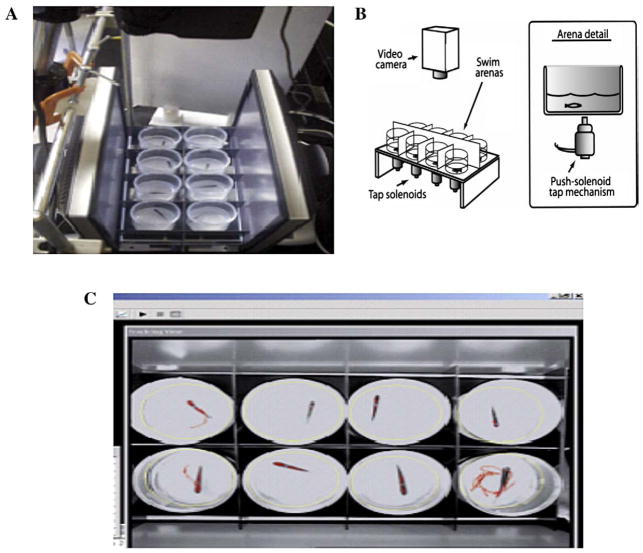
Fig. 1.
Diagram of the zebrafish startle testing method. A) Top view showing the orientation of the vibrational startle apparatus. This fish are tested in eight cylindrical chambers arranged between computer monitors (monitors are use to elicit visual startle). B) Schematic diagram illustrating the testing chambers above that tap solenoids which are computer driven to deliver a vibrational startle at 1 min intervals (ten total trials) and at 8, 32, and 128 min after the initial session trial. C) View of the computer screen showing the video tracking of eight zebrafish during the startle task.

