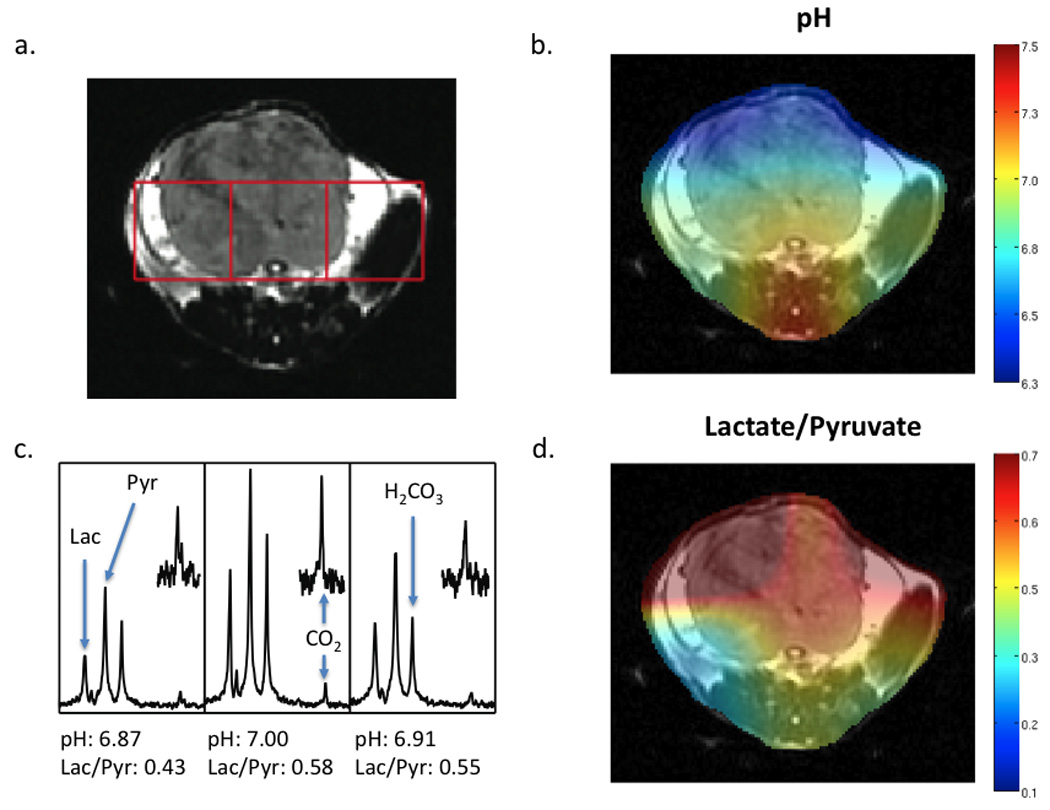
Figure 3.

In vivo data collected at 3T. A T2 weighted anatomic image (A), pH image of the same slice demonstrating the distribution of pH calculated (B), spectra for the corresponding voxels shown in the T2 weighted image (C) and the Lactate/Pyruvate ratio image (D) are shown for a TRAMP tumor bearing mouse. The tumor is visible in the upper half of the slice. Following dissolution, 300 µL of a solution 55 mM in pre-polarized 13C bicarbonate and 10 mM in 13C pyruvate were injected intravenously. Data was acquired with a resolution of 1 cm3. The pH for individual voxels was calculated using the Henderson-Hasselbalch equation and pKa of 6.17 at 37° C. The peak ratios of observed 13C lactate to 13C pyruvate are also shown beneath the corresponding spectra. Regions of the CO2 resonance have been scaled up to demonstrate the signal-to-noise achieved in each voxel.
