
. 2010 Apr 26;12(2):e11. doi: 10.2196/jmir.1520
©Lana Ivanitskaya, Jodi Brookins-Fisher, Irene O´Boyle, Danielle Vibbert, Dmitry Erofeev, Lawrence Fulton. Originally published in the Journal of Medical Internet Research (http://www.jmir.org), 26.04.2010
This is an open-access article distributed under the terms of the Creative Commons Attribution License (http://creativecommons.org/licenses/by/2.0/), which permits unrestricted use, distribution, and reproduction in any medium, provided the original work, first published in the Journal of Medical Internet Research, is properly cited. The complete bibliographic information, a link to the original publication on http://www.jmir.org/, as well as this copyright and license information must be included.
Figure 1.
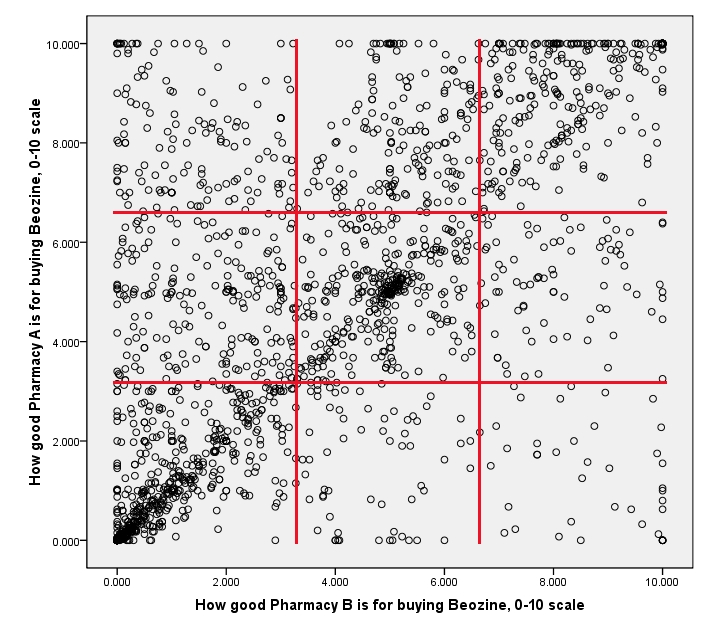
Scatter plot of respondents’ ratings of Pharmacies A and B (n = 1914)