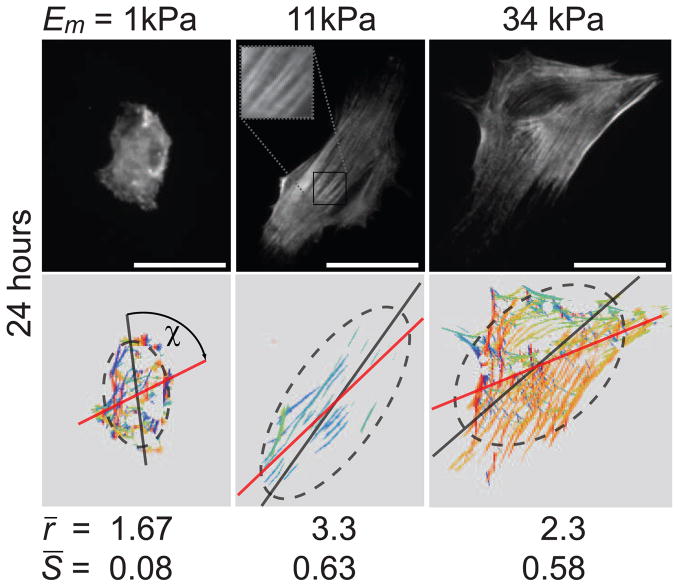
Figure 1.
Acto-myosin stress-fiber alignment in hMSCs sparsely plated on 2D substrates of different elasticity. The top row shows hMSCs immuno-stained for non-muscle myosin IIa (NMMIIa) 24 hours after plating on elastic substrates with a Young’s modulus Em of 1 kPa, 11 kPa, and 34 kPa that are the most representative cells of the mean values obtained for cell area A, aspect ratio of long to short axis r, and stress-fiber order parameter S = 〈cos2θ〉; where θ is the angle between each stress-fiber in the cell and the long axis of the fitted ellipse. The bottom row shows the respective orientational plots, where the different orientations of myosin filaments are depicted with different colours. The dark gray dashed ellipses are best fits to the cell edge and the red line indicates the mean orientation of the stress-fibers as determined by the automated algorithm. ξ is the angle between the mean stress-fiber orientation and the principal axis of the ellipse. From symmetry considerations we need only consider the absolute value of ξ between 0 and π/2; thus, a completely random distribution has an average ξ = π/4. Values given for r and S are the mean values of at least 60 cells per condition. All scale bars represent 50 μm.

