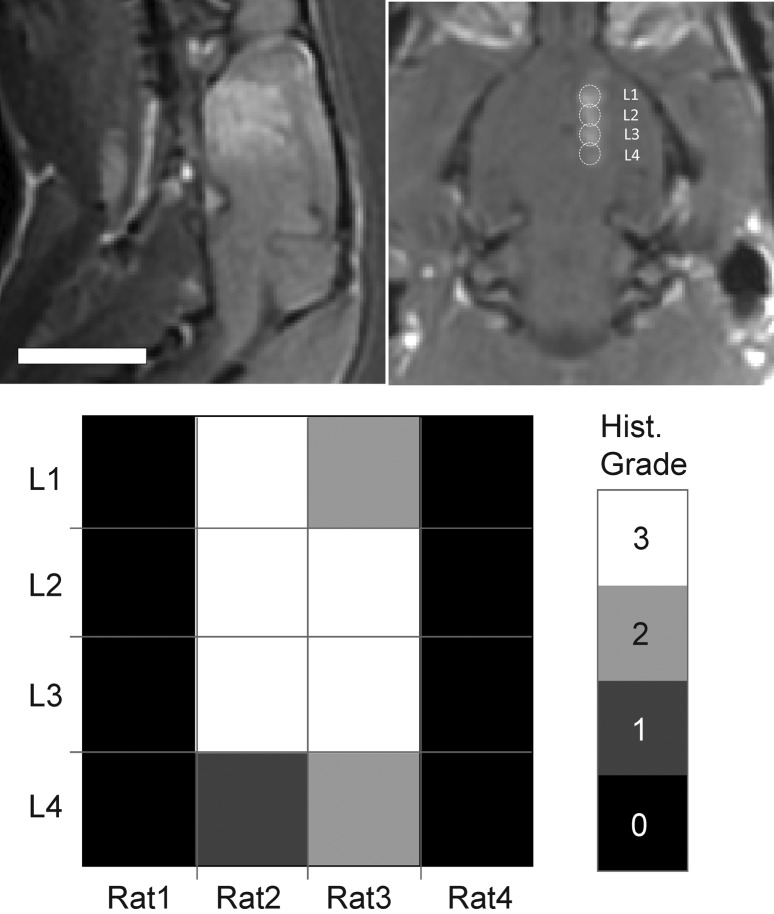
Figure 6.
A sagittal (left) and coronal (right) contrast-enhanced T1-weighted image in the rat brain after linear exposure of four locations in the brain following a single injection of ultrasound microbubbles. The region of signal enhancement is continuous and extends over a large area in the brain. The histological grade observed at each sonicated location across all rats is shown in the false colormap in the bottom panel.

