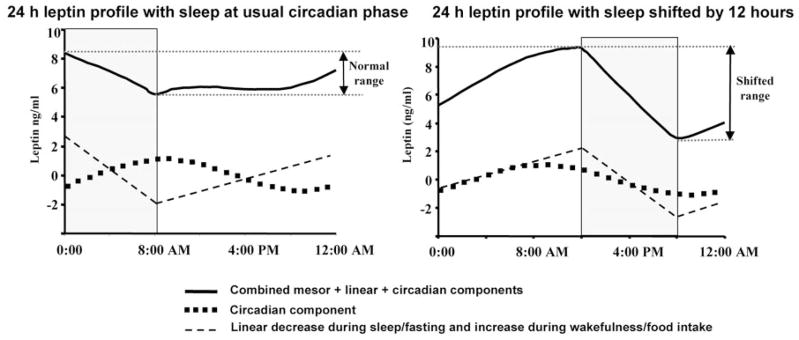
Fig. 4.
Adjusting sleep/wake schedule relative to the endogenous circadian phase increases the magnitude of the 24-h leptin profile. Left panel, Group mean 24-h circulating leptin profile with sleep occurring at the usual phase of the circadian rhythm; right panel, the same data but with sleep occurring at an unusual phase of the circadian rhythm (i.e. shifted by 12 h) as may occur during shift work. The sleep periods are shown by gray shaded blocks. The abscissa represents time of day. In each panel the thin dashed line depicts the group mean linear decrease during sleep/fasting and the linear increase during wakefulness/food intake, and the dotted line depicts the group mean circadian rhythmicity. The circadian time is the same in each panel, with the peak leptin attributable to the circadian system occurring around 0900 h (~3 h after the CBTmin). The top line in each panel represents circulating leptin (mesor plus circadian plus behavioral effects). When sleep occurs at an unusual phase of the body clock (right panel), the circadian and behavioral fluctuations are in phase, and the resultant circulating leptin has a larger 24-h fluctuation.

