
Figure 1.
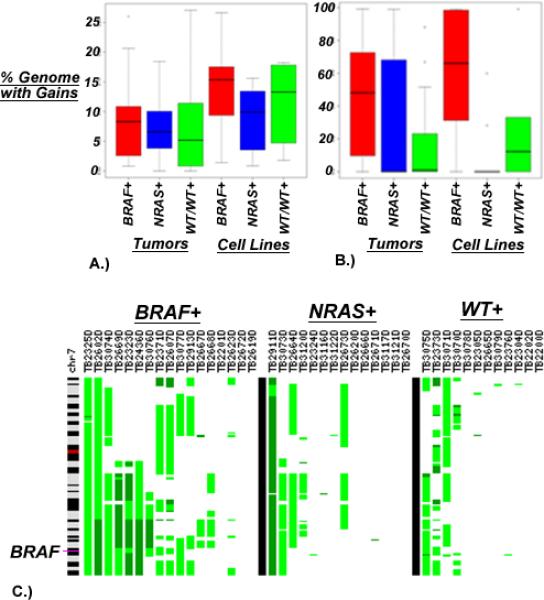
Copy number instability as measured by the proportion of each sample subject to DNA copy number gains in BRAF* tumors compared to NRAS* and BRAF/NRAS wt/wt (A) Total aberrations across the entire genome are higher in cell lines when compared to primary tumors (t-test; P = 0.0004), (B) Aberrations on chromosome 7 are more common in BRAF* tissues when compared to all BRAF wt tissues (P = 0.0199 and P = 0.0172 for tumors and cell lines respectively) (C) Specific gains of 7q32.1-36.3, represented in each sample as the green regions along the vertical ideogram of chromosome 7, strongly associate with BRAF* tissues.