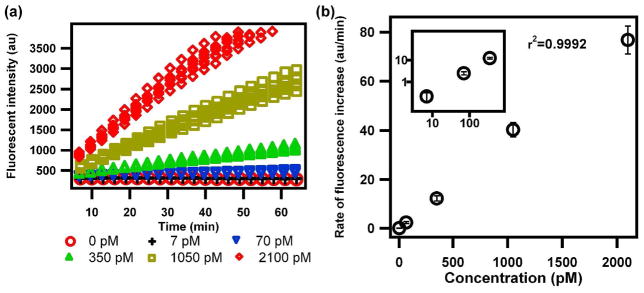
Figure 2.
Performing bead-based insulin immunoassays in SlipChip. (a) Kinetic curves of fluorescence over time for all the 42 samples on the SlipChip. As the insulin concentration increased, the rate of the enzymatic reaction increased. (b) A graph showing a calibration curve correlating insulin concentration to rate of fluorescence intensity on SlipChip. The insert shows the region of low concentration, plotted on a logarithmic scale. (n=7).

