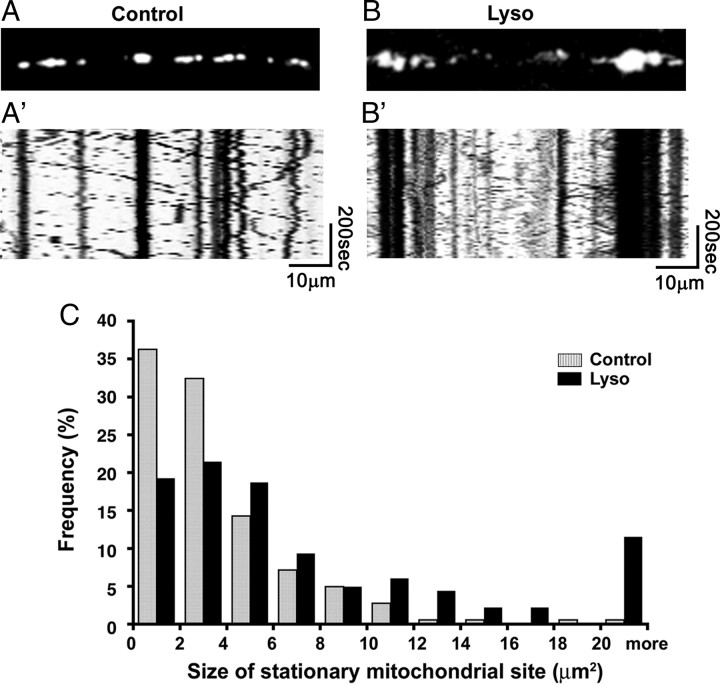
Figure 2.
Mitochondrial behavior before and after demyelination. A, B, Single frames from the time-lapse images. A′, B′, Kymographs of the time-lapse images. C, Sizes of stationary mitochondrial site in myelinated (control; gray bars) and demyelinated (Lyso; black bars) axons. The size of stationary mitochondrial sites is significantly increased (p < 0.01) in the demyelinated axons [n = 185 mitochondria (control); n = 182 mitochondria (lysolecithin treated)].

