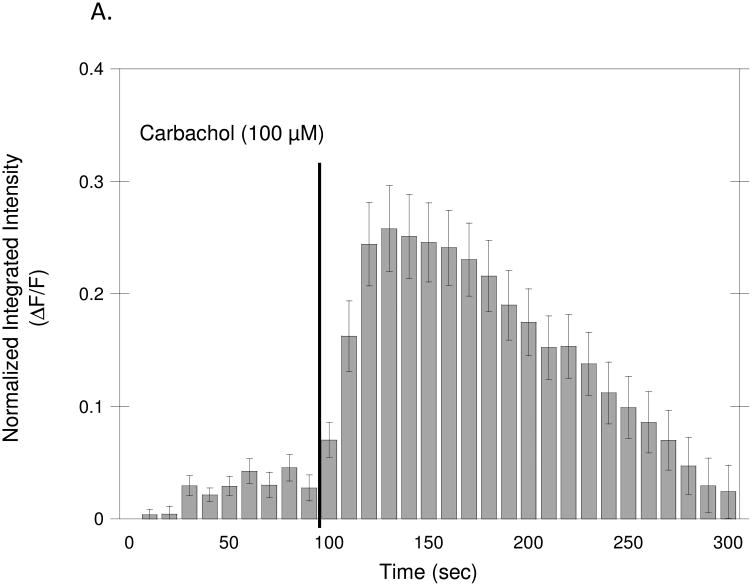
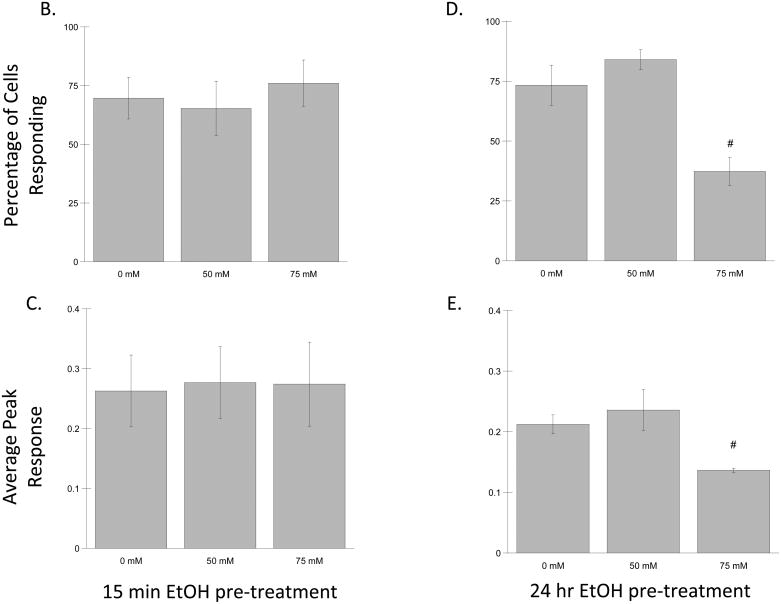
Figure 3. Effect of Ethanol on Carbachol-Stimulated Intracellular Calcium Mobilization.
Hippocampal neurons plated on glass bottom dishes and incubated with the intracellular calcium indicator Fluo3-AM, as described in Materials and Methods. (A) Average normalized fluorescence intensity before and after carbachol (100 μM) treatment. Each bar represents the mean (± SEM) of 50 cells. (B–E) Effect of ethanol on carbachol-induced increases in intracellular calcium after a 15 min (B, C) or 24 h (D, E) incubation with ethanol. (B, D) Percentage of cells responding to carbachol after treatment with ethanol. (C, E) Average peak response induced by carbachol after treatment with ethanol. Results are shown as the means (± SEM) of three separate experiments. (#p<0.05 compared to carbachol alone).


