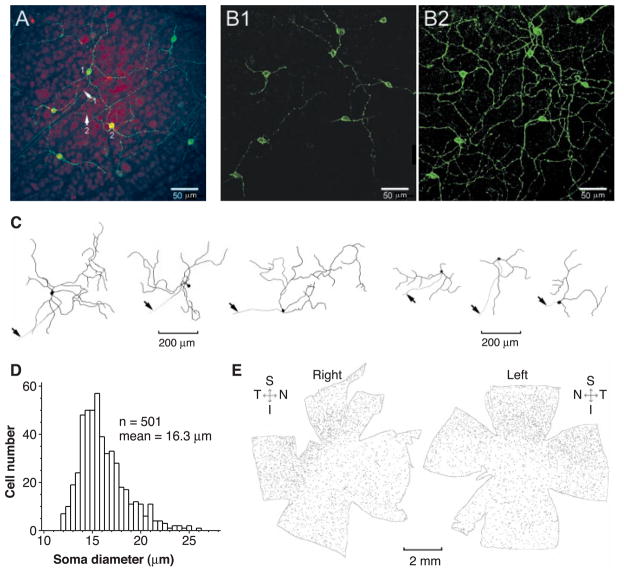
Fig. 1.
Immunocytochemistry of melanopsin-containing RGCs in the flat-mounted rat retina. (A) Confocal images at the level of the ganglion cell layer showing labeling with the melanopsin NH2-terminal specific antibody. The fluorescent immunolabeling is in green, and the nuclei are stained by red fluorescent propidium iodide. Arrows 1 and 2 indicate axons associated with the indicated RGC cell bodies heading toward the optic disc. Note the beaded appearance of the dendrites. Because the image is at a particular focal plane, some dendrites and axons are not visible. (B) Nonstacked (1) and stacked (2) confocal images of the same retinal field from another preparation, but without nuclear counterstaining. The stacked picture combined all focal planes containing labeled processes. Note the peripheral localization of the melanopsin-labeling in the cell bodies in (B1). Because the stacking increased background, the sensitivity of the camera was reduced, making some faint processes not clearly visible. (C) Camera-lucida drawings of several melanopsin-positive RGCs, obtained from stacked images. The beaded appearance of the dendrites is not shown. The left and right panels show nondisplaced and displaced RGCs, respectively. The displaced cells have smaller and apparently more sparse dendritic fields. Arrows indicate axons. (D) Soma-size distribution of (a sample of) nondisplaced melanopsin-positive RGCs, which account for >95% of all labeled RGCs. (E) Overall distribution of melanopsin-positive RGCs on the flat-mounted right and left retinas of the same rat. Dozens of local dark-field images were taken separately at low magnification, and the montage was assembled with Adobe Photoshop. Each cell body is represented by a dot of about the appropriate size. Note the higher cell density in the superior and temporal quadrants. Only nondisplaced RGCs (>95% of total) are included. S, superior; I, inferior; N, nasal; T, temporal.

