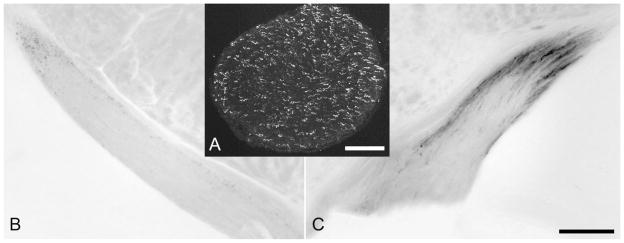
Fig. 2.
Distribution of axons of mRGCs in optic nerve and tract. A: Confocal image of axonal anti-β-galactosidase immunoreactivity in a transverse section of the optic nerve. B,C: X-gal staining of axons in the optic tract contralateral (B) and ipsilateral (C) to a monocular enucleation. Axonal degeneration is almost complete in B but nearly absent in C, indicating that, beyond the SCN, melanopsin RGCs have predominantly crossed projections. Scale bar = 100 μm in A; 200 μm in C (applies to B,C).

