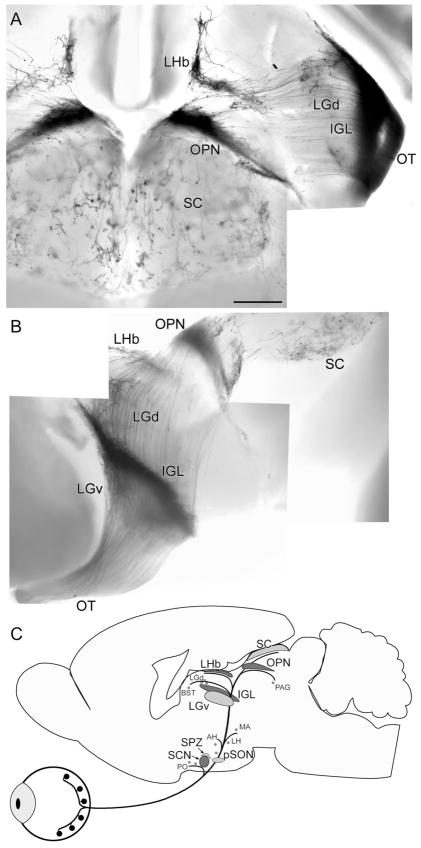
Fig. 3.
Overview of axonal projections of mRGCs. A,B: Whole brains stained by X-gal. A: Dorsal view, with rostral at the top. B: Lateral view with rostral at the left and dorsal at the top. C: Schematic drawing illustrating nuclear targets of melanopsin RGCs. Principle targets are shown in dark gray and secondary targets in light gray. Minor targets are indicated by small lettering and dots. For abbreviations, see list. Scale bar = 500 μm in A (applies to A,B).

