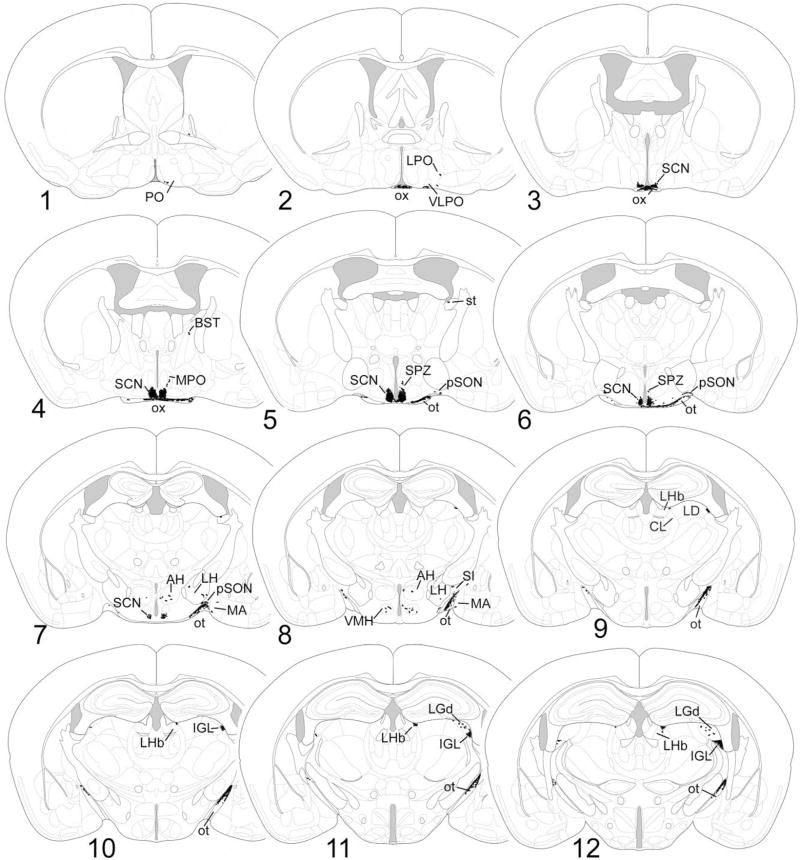
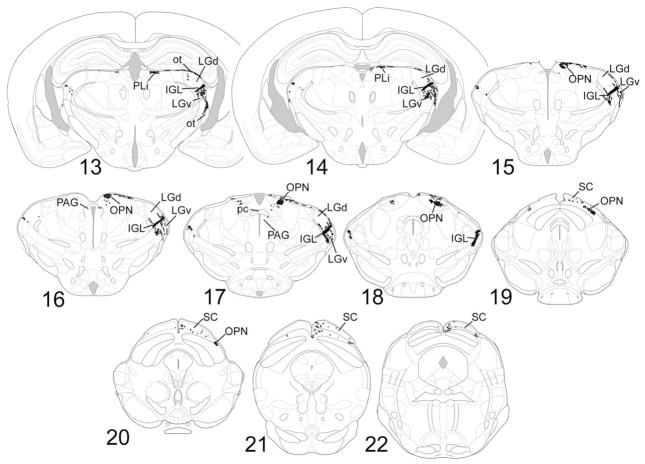
Fig. 4.
1–22: Chartings of schematic coronal sections, modified from the atlas of Paxinos and Franklin (2001), summarizing the distribution of X-gal-labeled fibers as seen in cases of monocular enucleation. The right side of the brain, shown on the right of each charting, is contralateral to the intact eye. For abbreviations, see list.


