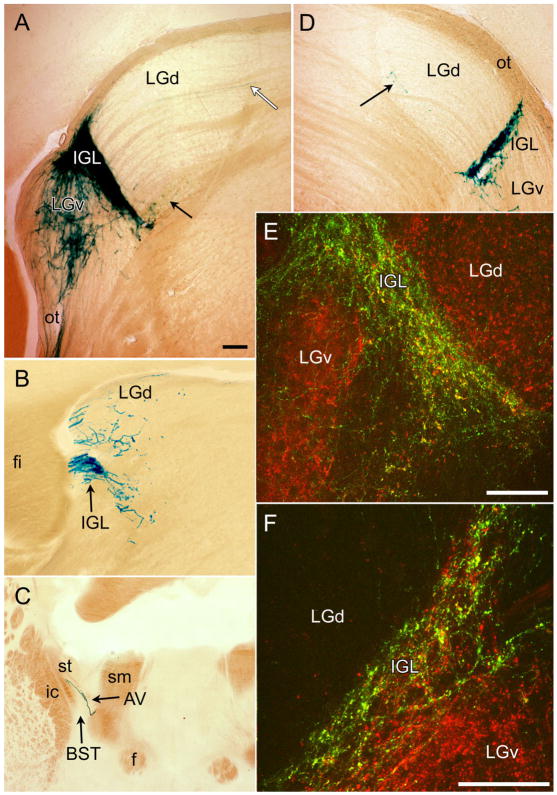
Fig. 7.
Distribution of afferents from melanopsin ganglion cells in lateral geniculate complex. A–D: Coronal sections reacted with X-gal. A and D are from middle of rostrocaudal extent of LGd. A is contralateral and D is ipsilateral to the remaining eye in a monocularly enucleated mouse. Black arrows indicate sparse terminal labeling near the ventromedial margin of LGd. White arrow in A indicates axon of passage in one of the fascicles traversing the LGd. B shows substantial terminal labeling at the rostral margin of the LGd as well as strong labeling of the IGL at this level. C shows the rostral limit of this terminal field in or near the BST. E,F: Confocal merged immunofluorescence images of the IGL and adjacent geniculate nuclei illustrating relationship between afferents from mRGCs of both eyes (green) and total retinal afferents (red) from one eye, either the contralateral eye (E) or the ipsilateral eye (F). Most retinal afferents to the IGL are from melanopsin RGCs (green and yellow puncta), but many are not (red puncta). Green profiles (without red) represent terminations of axons from mRGCs in the eye not injected with CTB. Most retinal afferents to the LGv do not arise from melanopsin RGCs. For abbreviations, see list. Scale bar = 100 μm in A–F.

