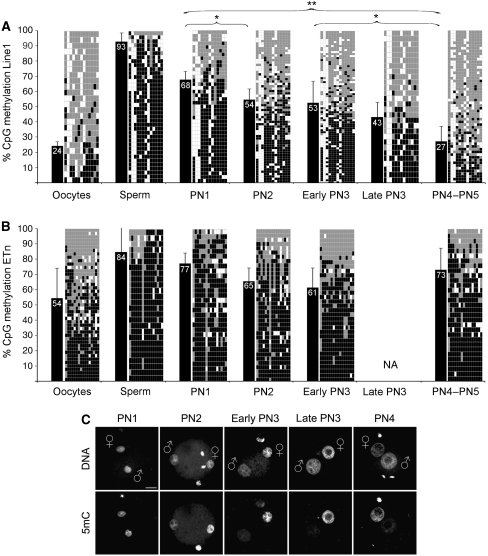
Figure 1.
Line1/ETn CpG methylation and loss of 5mC antibody signal during zygotic development. (A) Line1 CpG methylation of gametes and zygotes at distinct pronuclear stages reveals a stepwise demethylation process. Black bars indicate average methylation status. Diagrams specify analysed CpG positions where each row depicts an individual chromosomal Line1 pattern (black=methylated, grey=unmethylated, white=not analysable/mutated). Note the increasing mosaicism of methylated CpG positions over time. Asterisks indicate significant methylation changes between different pronuclear stages. (B) ETn CpG methylation of gametes and zygotes at distinct pronuclear stages. The methylation level also decreases from PN1 up to early PN3 likewise Line1. After completion of S-phase, the average methylation level increases again. (C) Representative IF analysis with a monoclonal Ab against 5mC during pronuclear stages (see also Santos et al, 2002). The major loss of Ab signal in the paternal pronucleus occurs between PN2 and PN3. Scale bar=20 μm.

