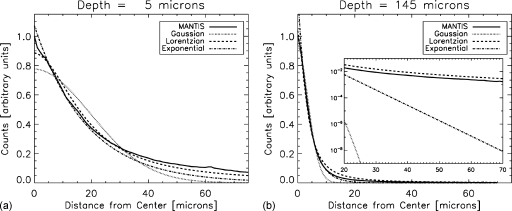
Figure 5.
Plots showing the normalized, radially averaged simulated optical-photon spread from MANTIS for two different depths; (left) 5 μm and (right) 145 μm with a zoom of the tails in the inset plot. The depth refers to the distance in the z direction between where the x-ray beam enters the CsI crystal and where the x ray is absorbed and produces the optical shower. The black lines show the radially averaged MANTIS results normalized to the maximum of the radially averaged profile. Fits of Gaussian, exponential, and Lorentzian functions are also shown. The Lorentzian shows the best overall fit to the data. In general, for optical photons produced deeper in the crystal, the Lorentzian tends to overestimate both the tails and the peak, while for shallower depths, it tends to underestimate both the tails and the peak.

