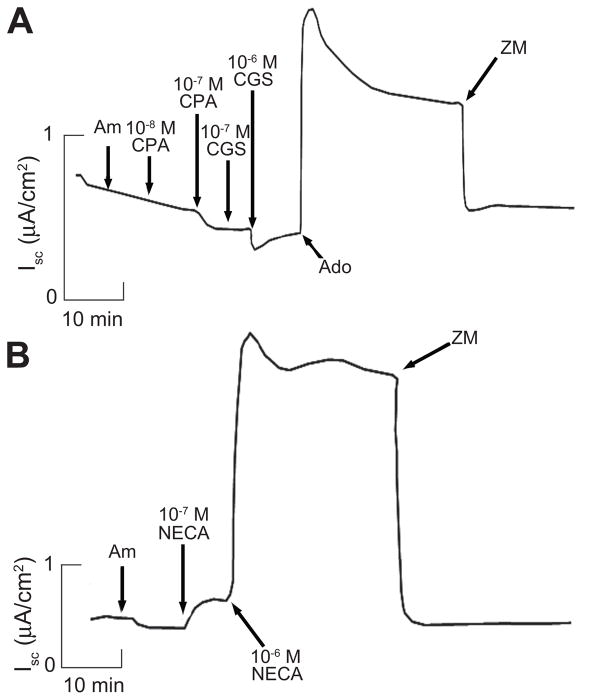
Figure 3.
A. Representative Isc trace showing actions of the A1 receptor-specific agonist CPA and the A2a receptor-specific agonist CGS21680 on Isc in mIMCD-K2 cells. Trace represents experiments performed on 16 filters. Am, 10−5 mol/L amiloride (apical addition); CPA, CPA concentrations mol/L (M) as specified; CGS, CGS21680 concentrations mol/L (M) as specified; 10−5 mol/L Ado, adenosine (apical addition); ZM, 10−5 mol/L ZM241385 (apical addition). B. Representative Isc trace showing action of the non-selective adenosine receptor agonist NECA. NECA concentrations mol/L (M) as specified. Trace represents experiments performed on 14 filters.

