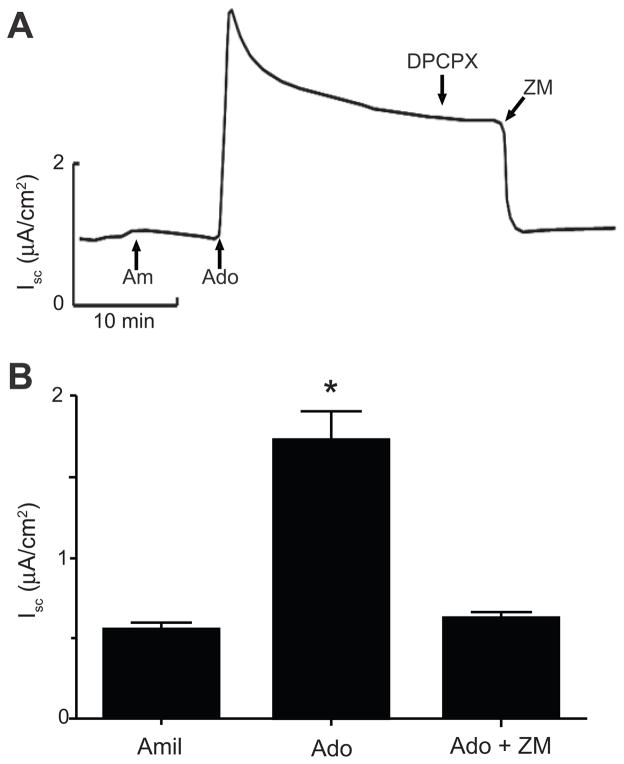
Figure 4.
A. Representative Isc trace describing the action of the specific A1 receptor antagonist DPCPX and the non-selective A2 receptor antagonist ZM241385 on adenosine-induced Isc in mIMCD-K2 cells. Am, 10−5 mol/L amiloride (apical addition); Ado, 10−5 mol/L adenosine (apical addition); DPCPX, 2 × 10⁻⁸ mol/L DPCPX (apical addition); ZM, 10−5 mol/L ZM241385 (apical addition). B. Average Isc values after sequential addition of amiloride (Amil), adenosine (Ado), and ZM241385 (ZM). Values are mean ± SE (n = 23 cell sheets). Statistical significance between the different conditions was compared as indicated. *P<0.05.

