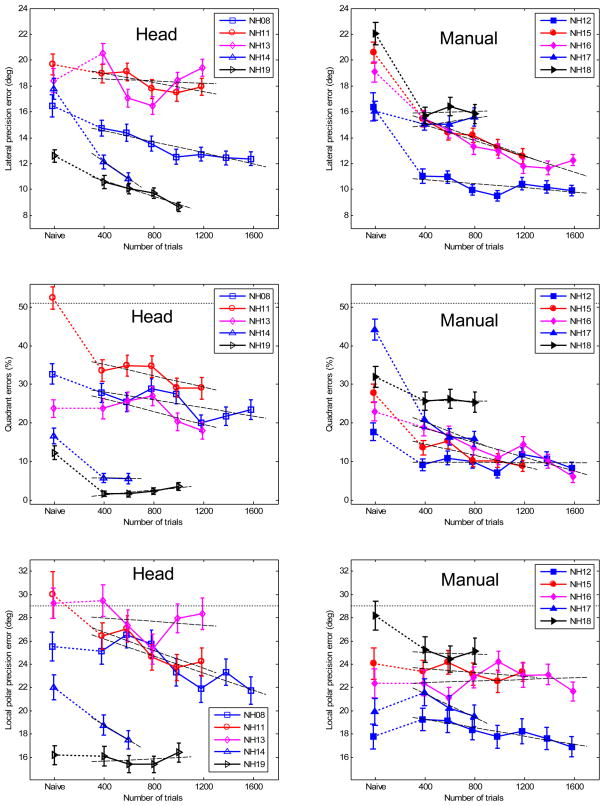
Figure 7.
(color online). Training results for each subject. Left panels: head-pointing method; Right panels: manual-pointing method. Top panels: lateral precision errors; Middle panels: quadrant errors; Bottom panels: local polar precision errors. The data shown at “Naive” represent the results from experiment 1. The other data show the averages of the progress of training in steps of 200 trials, 400 trials for each point. The error bars show the standard deviation of the bootstrapped errors (see text). The dashed lines represent the regression line fitted to the training data. The horizontal dotted lines represent chance rate.

