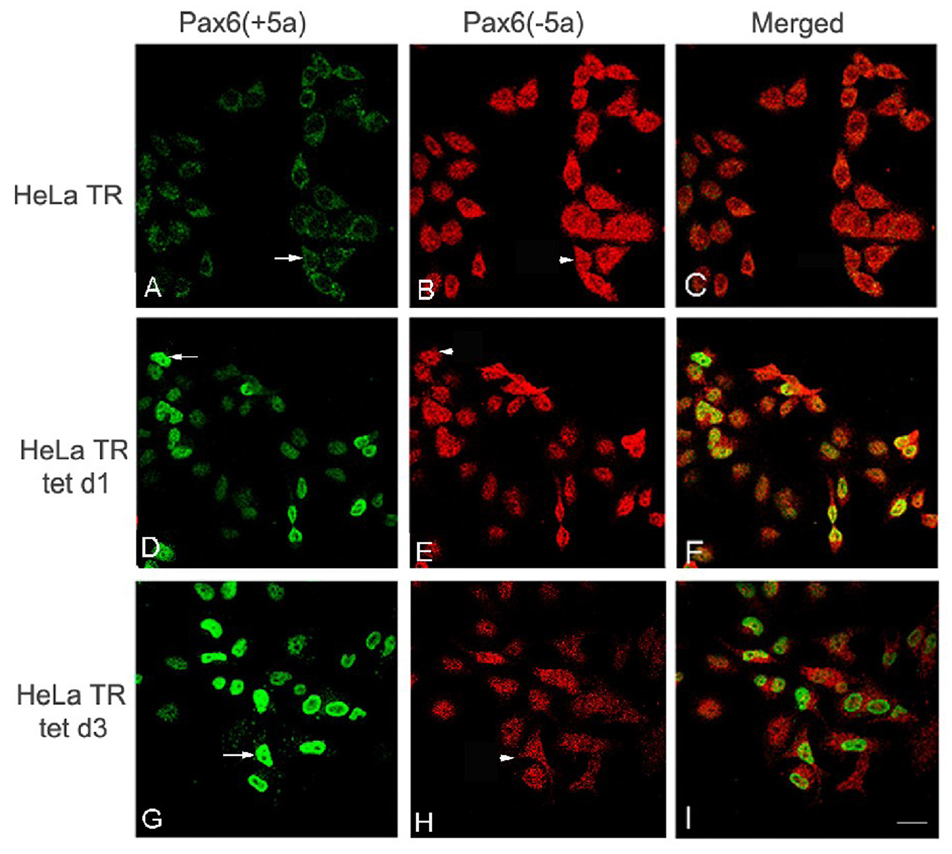
Fig. 5. Induced overexpression of Pax6(+5a) is accompanied by the reduction of Pax6(−5a).
Immunofluorescent laser confocal light microscopy shows the time course of Pax6(+5a) and Pax6(−5a) expression in HeLa Tat-TetR-Pax6 cells double labeled using anti-Pax6(+5a) and anti-Pax6(−5a). A–C: Pax6(+5a) and Pax6(−5a) expression in HeLa Tat-TetR-Pax6 cells without (HeLa TR) induction of Pax6(+5a) overexpression. D–F: HeLa Tat-TetR-Pax6 cells at day 1 (HeLa tet d1) with induction of Pax6(+5a) overexpression. G–I: HeLa Tat-TetR-Pax6 cells at day 3 (HeLa tet d3) with induction of Pax6(+5a) overexpression. Note: compared with A, many cells in D show moderately increased Pax6(+5a) expression and show dramatically increased expression in G (arrows). On the other hand, Pax6(−5a) shows slightly decreased expression in cells in D but more pronounced decrease in expression in H when compared to A (arrowheads). A, D, and G: Pax6(+5a); B, E, and H: Pax6(−5a); C, F, and I: Merged Images. Bar: 25 µm.

