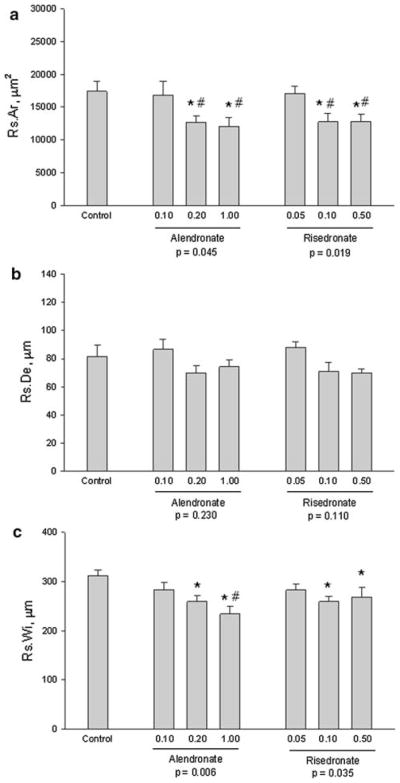
Fig. 2.

Basic multicellular unit resorption parameters. a Resorption area, b depth, and c width. Differences among groups were assessed separately for control and alendronate groups and for control and risedronate groups with post hoc tests within those groups when appropriate (overall P < 0.05). Data presented as mean ± standard errors from 8–12 animals per group. P < 0.05 vs. control (*) and low dose within treatment (#). No differences were found between RIS and ALN at equivalent doses, nor between the middle and high dose within treatment groups
