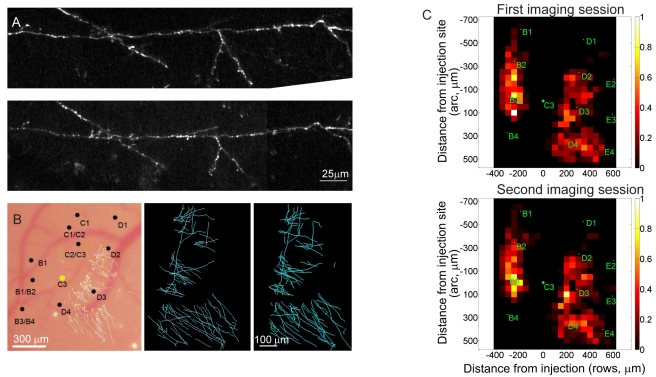
Figure 2. Axons and synaptic boutons during normal experience.
(A) Axons at initial imaging session (top) and 1 wk later (bottom). (B) Axonal arbors imaged at two time points. Left, map of the whisker representation superimposed with the reconstruction of axons projecting toward rows D and E. Middle, reconstruction of the long-range horizontal axons imaged the first session. And right, 1 wk later. (C) Distribution of axonal density surrounding the injection site, averaged over all the control animals. Bins are spaced at 100 µm intervals with the injection site at (0,0,0). Axons immediately surrounding injection are not shown. Top, first imaging session. Bottom, second imaging session.

