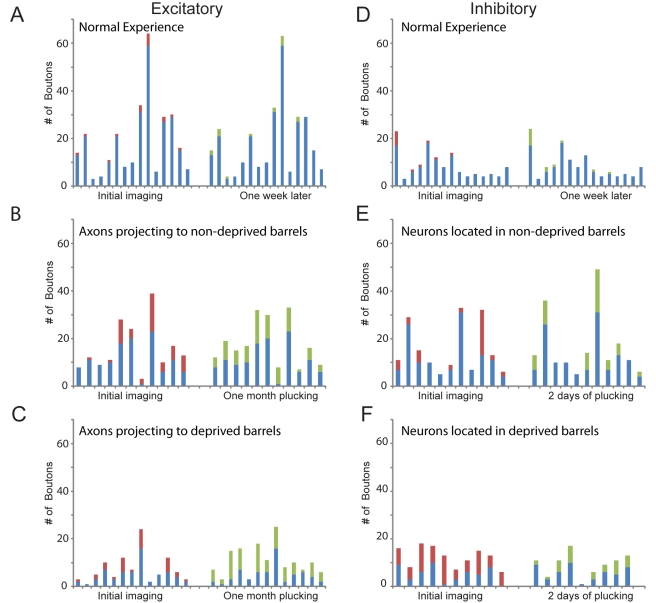
Figure 3. Bouton dynamics of selected axons in superficial cortical layers of whisker barrel columns of deprived and non-deprived animals.
Graphs depict the number of boutons on axons before and after whisker plucking. Each bar represents a single identified axon, imaged before (left set) and the same axons imaged after whisker plucking (right set). Blue: stable boutons, red: eliminated boutons, green: added boutons. (A–C) Excitatory neurons. (A) Bouton turnover in whisker barrel columns in animals that underwent normal experience. (B) Bouton turnover during whisker plucking for axons projecting into non-deprived barrel columns and (C) projecting into deprived barrel columns (D–F) Inhibitory interneurons. (D) Bouton turnover in whisker barrel columns of animals that underwent normal experience. (E) Axonal boutons of neurons located in non-deprived barrel columns before and after whisker plucking. (F) Boutons of neurons located in deprived barrel columns.

