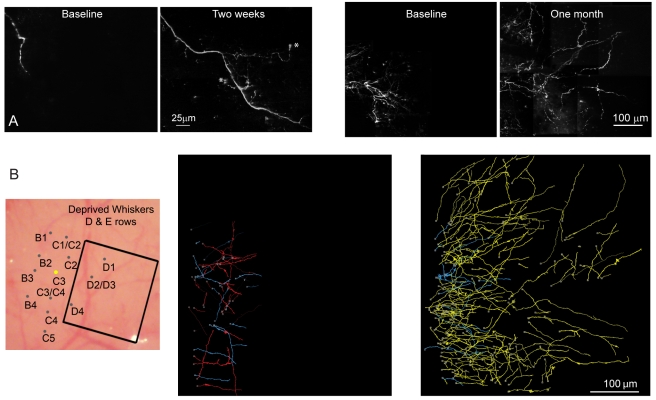
Figure 4. Axons of layer 2/3 excitatory neurons originating from C3 barrel column projecting to deprived barrel columns following whisker plucking.
(A) Left: Montage of z-projections located within a deprived barrel column before (far left) and after (second from left) 14 d of whisker plucking. Right, Montage of z-projections of a cluster of axons located within deprived cortex both before (3rd from left) and after (far right) 1 mo of whisker plucking. * - denotes putative growth cone. (B) Axons originating from C3 injection site projecting to rows D and E following whisker plucking. Left, the map of the barrel column field. The square box depicts the region shown in the two reconstructions to the right. Middle, axons located within D and E rows before plucking. Right, same area after 1 mo of plucking. Axons that were stable over the two imaging sessions are shown in blue; axons that retracted from the first to second imaging session are in red; new axons are plotted in yellow.

