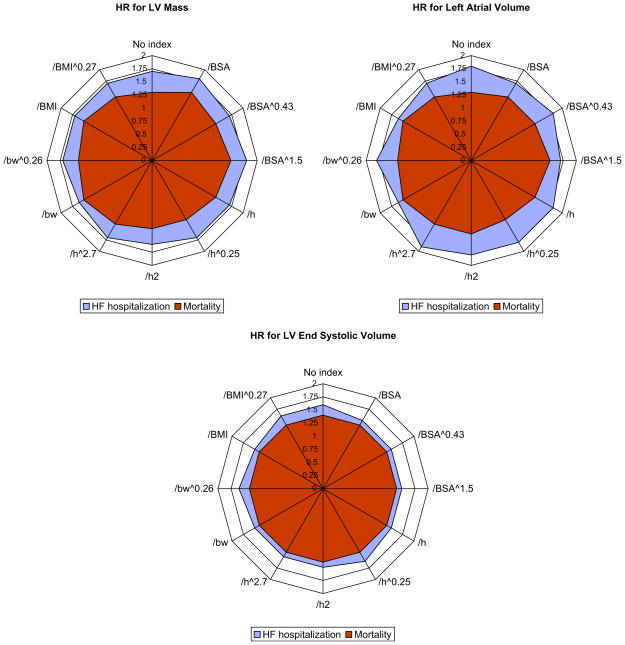
Figure 2.
HRs per standard deviation (as shown in Table 3) increase in variables indexed to different parameters of body size in the entire sample (n = 1,024). A circular configuration of the radial plot indicates equivalence among indexing methods. LV, Left ventricular; BSA, body surface area; h, height; bw, body weight; BMI, body mass index. The numeric values used to create these plots are listed in Table 4.

