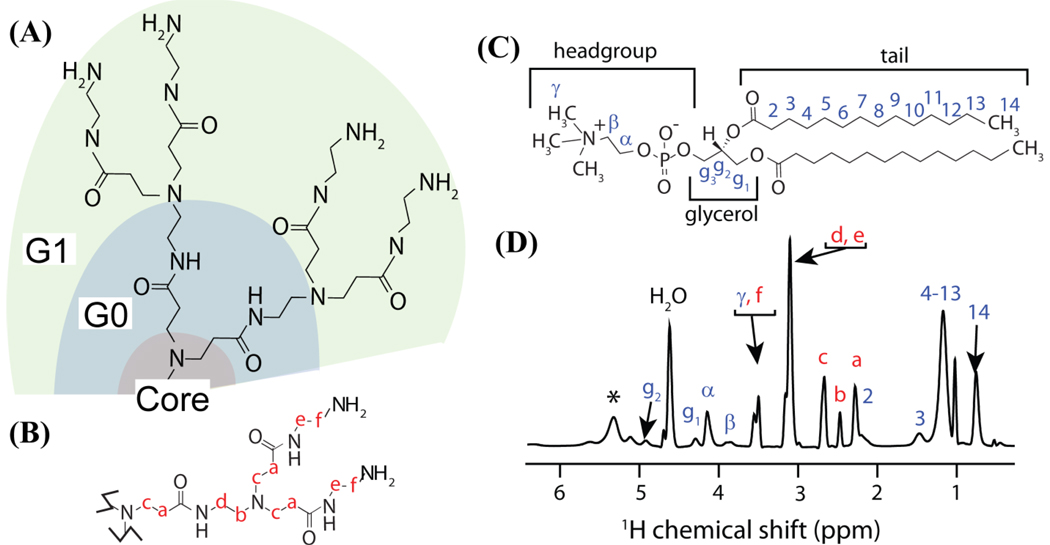
Figure 1.
(A) One-half of a G1 PAMAM dendrimer. The generation number may be visually assessed by counting the number of forks per branch of the dendrimer, excluding the fork of the core ethylenediamine molecule. The core, zeroth, and first generation parts of the dendrimer are labeled. (B) A branch of the dendrimer with its carbon atoms labeled in red. (C) A DMPC molecule. (D) A 1H MAS NMR spectrum of DMPC mixed with 0.1 mol % G5 PAMAM dendrimer (sample B2; see methods and materials); spinning sideband is indicated with an asterisk. The mixture was 50 % hydrated by weight. Proton resonances originating from the dendrimer and lipid are labeled in red and blue respectively; resonances were assigned based on previous NMR studies.38,62

