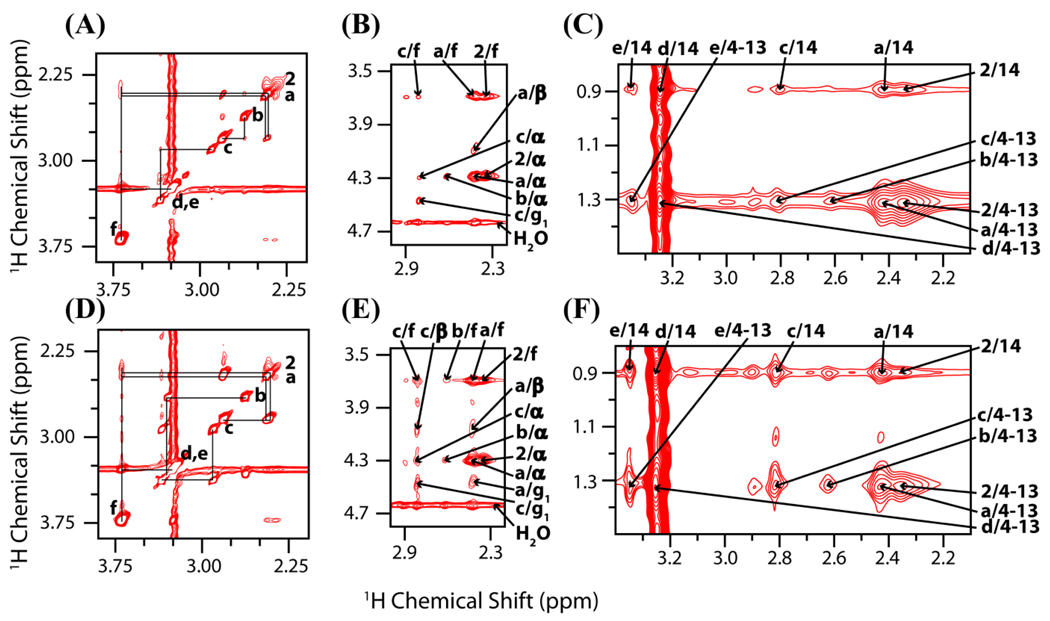
Figure 2.
The 2D 1H-1H MAS NOESY and RFDR spectra of the dendrimer and lipid mixture (acquired on samples B1 and B2; see methods and materials). Different regions of the NOESY spectrum acquired with a 150 ms mixing time showing (A) dendrimer intramolecular crosspeaks, (B) dendrimer-lipid headgroup crosspeaks, and (C) dendrimer-lipid tail crosspeaks. Bottom: Different regions of the 1H RFDR spectrum acquired with a 30 ms mixing time showing (D) dendrimer intramolecular crosspeaks, (E) dendrimer-lipid headgroup crosspeaks, and (F) dendrimer-lipid tail crosspeaks. The crosspeaks are numbered according to the scheme described in Figure 1.

