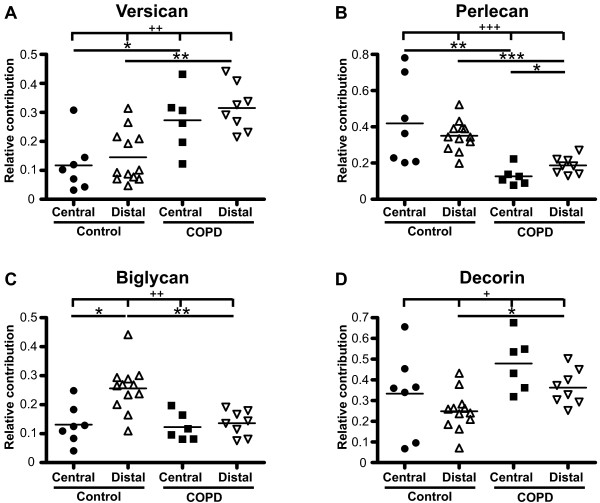
Figure 6.
Profile of proteoglycan production. Fibroblasts were incubated for 24 hours in cell medium containing 0.4% serum, and individual proteoglycans were separated and quantified on SDS-PAGE gels to determine the contribution of each to the total proteoglycan production. Each point shows the relative contribution of individual proteoglycans to the total proteoglycan content defined as the sum of versican, perlecan, biglycan and decorin (set as 1). Graph A shows versican, B perlecan, C biglycan, and D decorin. * P < 0.05, ** P < 0.01, *** P < 0.001, + P < 0.05, ++ P < 0.01, +++ P < 0.001.

