
Figure 6.
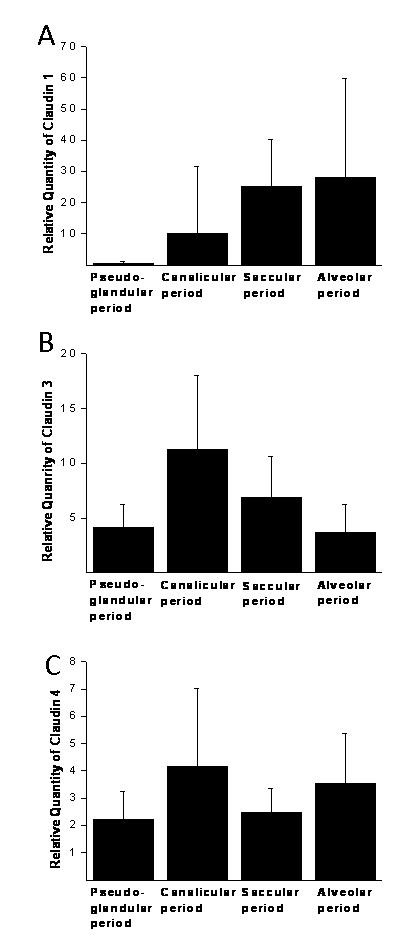
Summary of the quantitative RT-PCR results showing the expression of claudin-1 (A), claudin-3 (B) and claudin-4 (C) in various gestational stages. Results are shown as mean values and error bar represents the standard deviation.
Official websites use .gov
A
.gov website belongs to an official
government organization in the United States.
Secure .gov websites use HTTPS
A lock (
) or https:// means you've safely
connected to the .gov website. Share sensitive
information only on official, secure websites.
Summary of the quantitative RT-PCR results showing the expression of claudin-1 (A), claudin-3 (B) and claudin-4 (C) in various gestational stages. Results are shown as mean values and error bar represents the standard deviation.