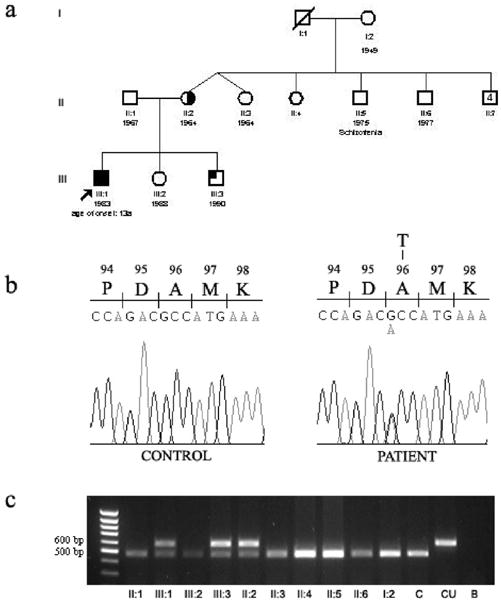
Figure 2.

Pedigree of the family in study (a): black square = individual with clinical signs, low ferritin levels, MRI findings and FTL mutation; half-filled circle = low ferritin levels, MRI findings and FTL mutation; low ferritin levels and FTL mutation; circle or square with an n = no FTL mutation. Molecular analysis revealing the heterozygous 474 A>G sequence change in the FTL gene: (b) sequencing chromatogram of the PCR product including exons 3 and 4 of the patients and (c) PCR-RFLP analysis of all family members available for study. C- control individual, CU –undigested PCR product, B-PCR blank.
