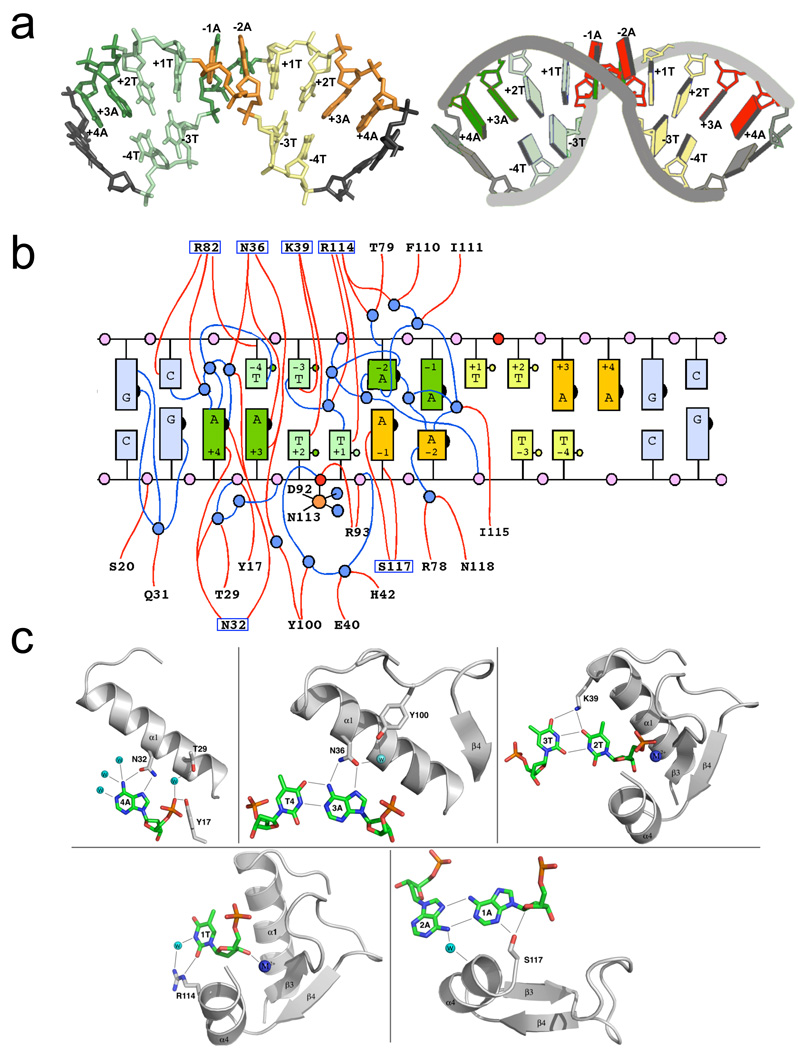
Figure 4. DNA recognition and binding by PacI.
Panel a: Conformation of the bound DNA target site. The individual bases of the 'TTAATTAA' target are colored both by their position in the original DNA half-site (left half-site = green; right = yellow) and by their identity (dark bases are adenine; light bases are thymine). The bound DNA is shown in a stick representation on the left, and in a cartoon representation, generated by the program 3DNA (Zheng et al., 2009), on the right. Those bases that lie outside the eight base pair target site are colored grey. Panel b: Cartoon representation of the base pairing interactions between the two target site strands and the contacts between the protein, DNA and solvent molecules. The individual bases are colored as shown in panel (a) above. The numbering of the bases corresponds to the position in the original unbound target sequence, with bases −4T to −1A corresponding to the 5' half (left half) of the target site along one DNA strand, and bases +1T through +4A corresponding to the 3' (right) half of the target site along the same strand. In the bound complex, all bases in the target are removed from their original Watson-Crick partners, so that some bases are unpaired (+1T and +4A on each strand), some are found in noncanonical A:A and T:T base pairs (+2T, −1A, −2A and −3T on each strand) and some are found in new Watson-Crick base pairs (−4T with +3A from each strand). The scissile phosphates on each strand are red; well-ordered water molecules are blue. Protein residues (from only one of the two protein subunits, for clarity) that are involved in direct or water-mediated contacts to the DNA are indicated; those that form direct contacts to DNA bases are boxed. Panel c: Structural interactions between each unique DNA base or base pair in a single half-site to solvent and protein residues. The numbering of bases is consistent with panels a and b above. See also supplemental figure S4.

