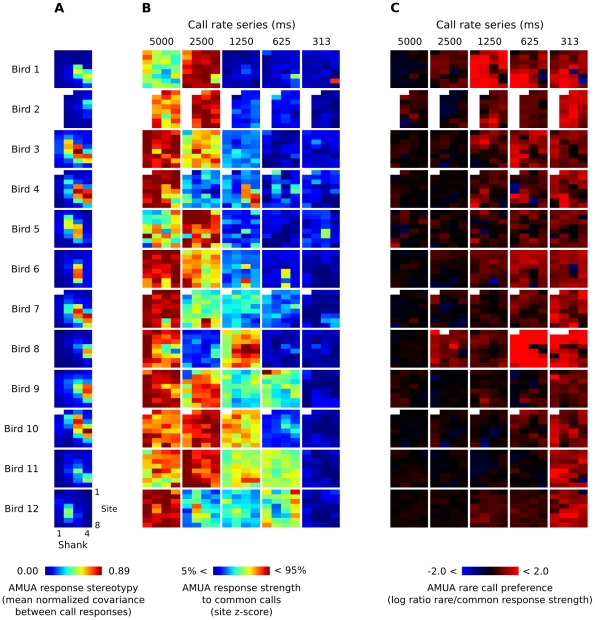
Figure 5. AMUA response measures for all sites from which we recorded in this study.
Each of the 32-pixel colored square corresponds to the matrix of 4×8 sites of a multi-electrode array that was used for simultaneous recordings (see Figure 2). (A) Response stereotypy for each electrode site in each bird, based on responses to both common and rare calls in all six sequences. Sites with a relatively high response stereotypy correspond to the anatomical area L2. In four birds one or more sites are lacking, because they did not show auditory AMUA responses. (B) Modulation of response strength to common calls between call series with different recurrence rates. Response strength has been normalized to a z-score per site; color differences between sites are thus meaningless. Scores outside the 5–95% range have been clipped for visual presentation. Note that for each series birds received different calls, which may explain part of the variation in response strength. (C) Rare call preference, calculated as the log of the ratio between mean response strength to rare and common calls within one series. A score of 0 (black sites) indicates no preference, while negative scores (blue sites) indicate a common call preference and positive scores (red sites) indicate a rare call preference. Scores have been clipped to range between −2 and 2 for visual presentation.

