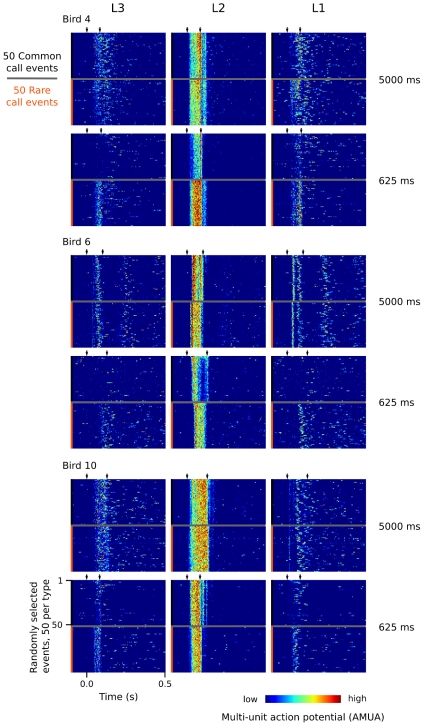
Figure 6. Examples of response patterns to a random 50 common and a random 50 rare calls in three different birds for two different rate sequences.
For each bird and rate sequence, the responses of three sites are shown: the middle column shows that of a L2 site, while the first and last column show that of adjacent L3 and L1 sites, which are situated caudal and rostral to L2, respectively. The sites (shank, site) shown are: Bird 4 (2,6), (3,5), (4,4), Bird 6: (2,6), (3,4), (4,5), Bird 10: (3,8), (4,5), (4,3). Color represents AMUA amplitude, scaled per site, and clipped to 25% and 75% of the total signal range for visual presentation only.

