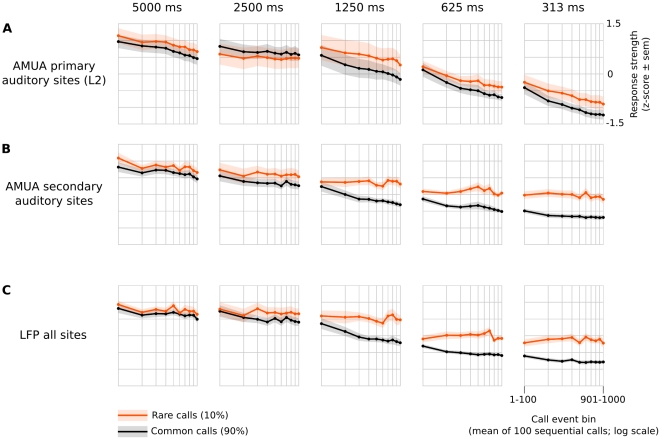
Figure 7. Response strengths decrease with calling rate and are partly stimulus-specific.
The responses are standardized (z-scores), but note that all statistical tests in this study are based on absolute response levels. Shown are the mean of these values over birds (± standard error of the mean as shaded color), binned per 100 sequential call events and split between common and rare calls. (A) Mean (N = 9 birds) AMUA response strength at primary auditory sites. These sites have been classified as ‘primary’ based on their stimulus-locked, stereotypic response characteristics only; such sites cluster in a shape that corresponds to the anatomical area L2. (B) Mean (N = 12 birds) AMUA response strength at secondary auditory sites, i.e. sites whose auditory responses are not stereotypic responses and that surround L2 (i.e. L1, L3, NCM and CMM). (C) Mean (N = 9 birds) LFP response strength, which is not split between primary and secondary sites because local field potentials may not originate from the immediate vicinity of the site at which they are recorded.

