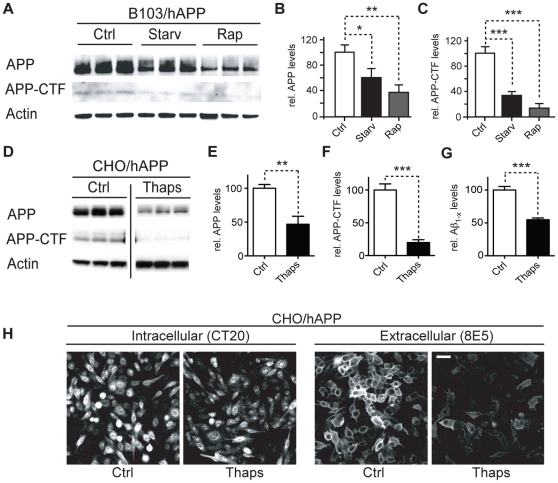
Figure 1. Activation of autophagy promotes APP, APP-CTF, and Aβ degradation.
A–C. B103/hAPP cells were left untreated (Ctrl), starved for 90 min in HANKS solution (Starv), or treated with 100 nM rapamycin in DMEM (Rap) for 90 min. Western blots (A) and quantification (B, C) of RIPA cell lysates probed with the CT15 antibody recognizing full-length APP and APP-CTFs and with an actin antibody as a control for loading. D–F. CHO/hAPP cells were left untreated (Ctrl) or treated for 12 hrs with 3 µM thapsigargin (Thaps) in DMEM/10%FBS. Western blots (D) and quantification (E, F) of RIPA cell lysates probed with antibodies as in A. (Data from the same blot. The vertical line indicates removal of three lanes not part of this experiment.) G. Secretion of Aβ into the cell supernatant was measured by ELISA (12 hrs/1 µM Thaps) H. Epifluorescence microscopy images of CHO/hAPP cells treated as in D, permeabilized with Tween and stained with antibody CT20 to label all cellular APP, or not permeabilized and stained with antibody 8E5 which recognizes the ectodomain of APP at the cell surface (scale bar represents 25 µm). Bars are mean ± SEM from triplicate cultures of at least two independent experiments. * p<0.05, ** p<0.01, *** p<0.001 by unpaired Student's t test.

