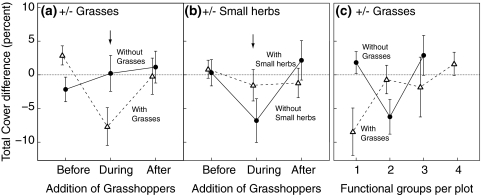
Fig. 2.
Total cover differences between herbivory and control cages (mean ± SE, n = 81). Arrows in (a) and (b) indicate when grasshoppers were added to the cages. Negative differences (below the dotted horizontal line) indicate lower cover in herbivory than in control cages. a,b Effects of grass and small herb presence before, during and after addition of grasshoppers. c Interaction between grass presence and functional group richness. Open triangles (filled circles) and dashed (solid) lines indicate presence (absence) of each plant functional group in (a–c)

